Uranium’s primary demand source is world electricity production. As the world economy and population grows, so does the need for electricity. The world’s demand for electrical energy is seemingly unwavering, because throughout the last four decades, electrical energy output has continually increased, even though we have experienced major economic black swans across the globe.
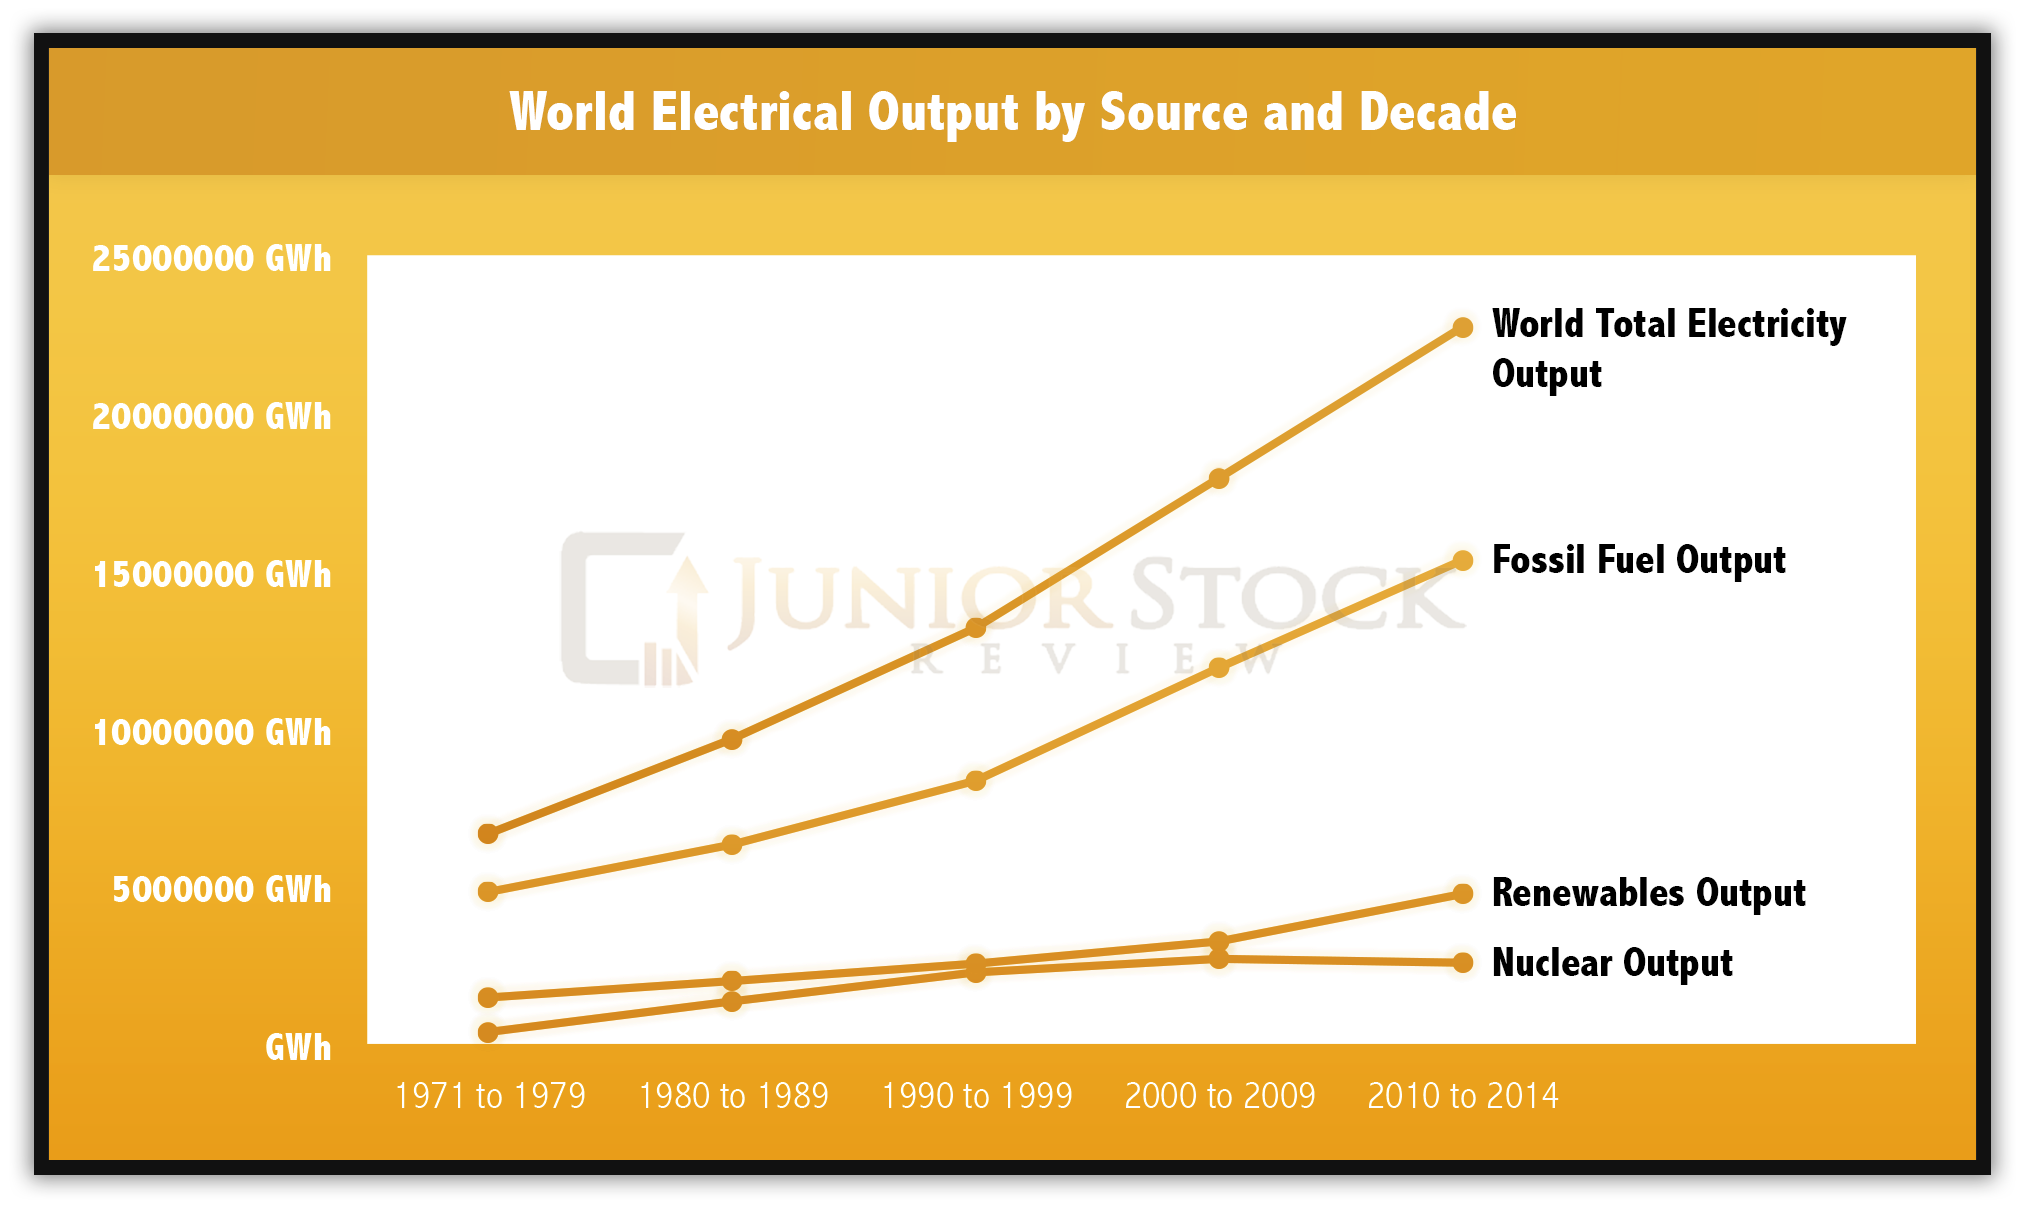
NOTE: In the graph, World Energy Output by Source and Decade:
‘Renewables’ includes: hydro, geothermal, solar, wind, tidal and bio-fuels
‘Fossil Fuels’ includes: coal, peat, oil shale, oil and natural gas
While world total electrical demand has gone up in the face of economic and political turmoil, the same can’t be said for the fuels that generate the electricity. Specifically, I am referring to nuclear power and its fall from grace after Fukushima. In the World Energy Output by Source and Decade graph, you can clearly see that nuclear power usage has gone down, while renewables has seen a dramatic uptick in their contribution to the electrical grid.
As discussed in Part 2, The Uranium Supply Story, Fukushima had a dramatic effect on the world’s nuclear power usage. Whether it be concern of a nuclear meltdown or storage of depleted uranium, a common consensus amongst select few is that nuclear power may not be the best choice for future energy production.
Politics & How They Influence Uranium Demand
Nuclear Weapon Super Powers
As discussed in Part 2 of this series, the first major uranium exploration cycle was military driven. The cold war propelled the world’s nuclear super powers to find and control as much uranium as possible and to convert it into weapons. Fast forwarding to the last few decades when Mega Tons to Mega Watts was introduced, and Russian nuclear weapons are being converted into Low Enriched Uranium (LEU) and down blended plutonium for use in nuclear power plants. If you tune into the news, however, you will know that this has already changed. I speculate that it’s only the beginning and that the ‘good will’ is set to disintegrate further in the future.
On October 3 2016, the BBC published an article about the Russians suspending the agreement they had made with the United States (U.S.) regarding plutonium down blending for civil use. Check it out: BBC article. To summarize from the article, where Vladimir Putin states that Russia had to take “urgent measures to defend the security of the Russian federation…we fulfilled our duties, we built that enterprise. But our American partners did not.”
Is this the beginning of a new aged Cold War? My thought is that we have to at least contemplate it when looking at uranium demand, because statements like this feel like the beginning of something much larger.
Who Controls the Uranium Supply?
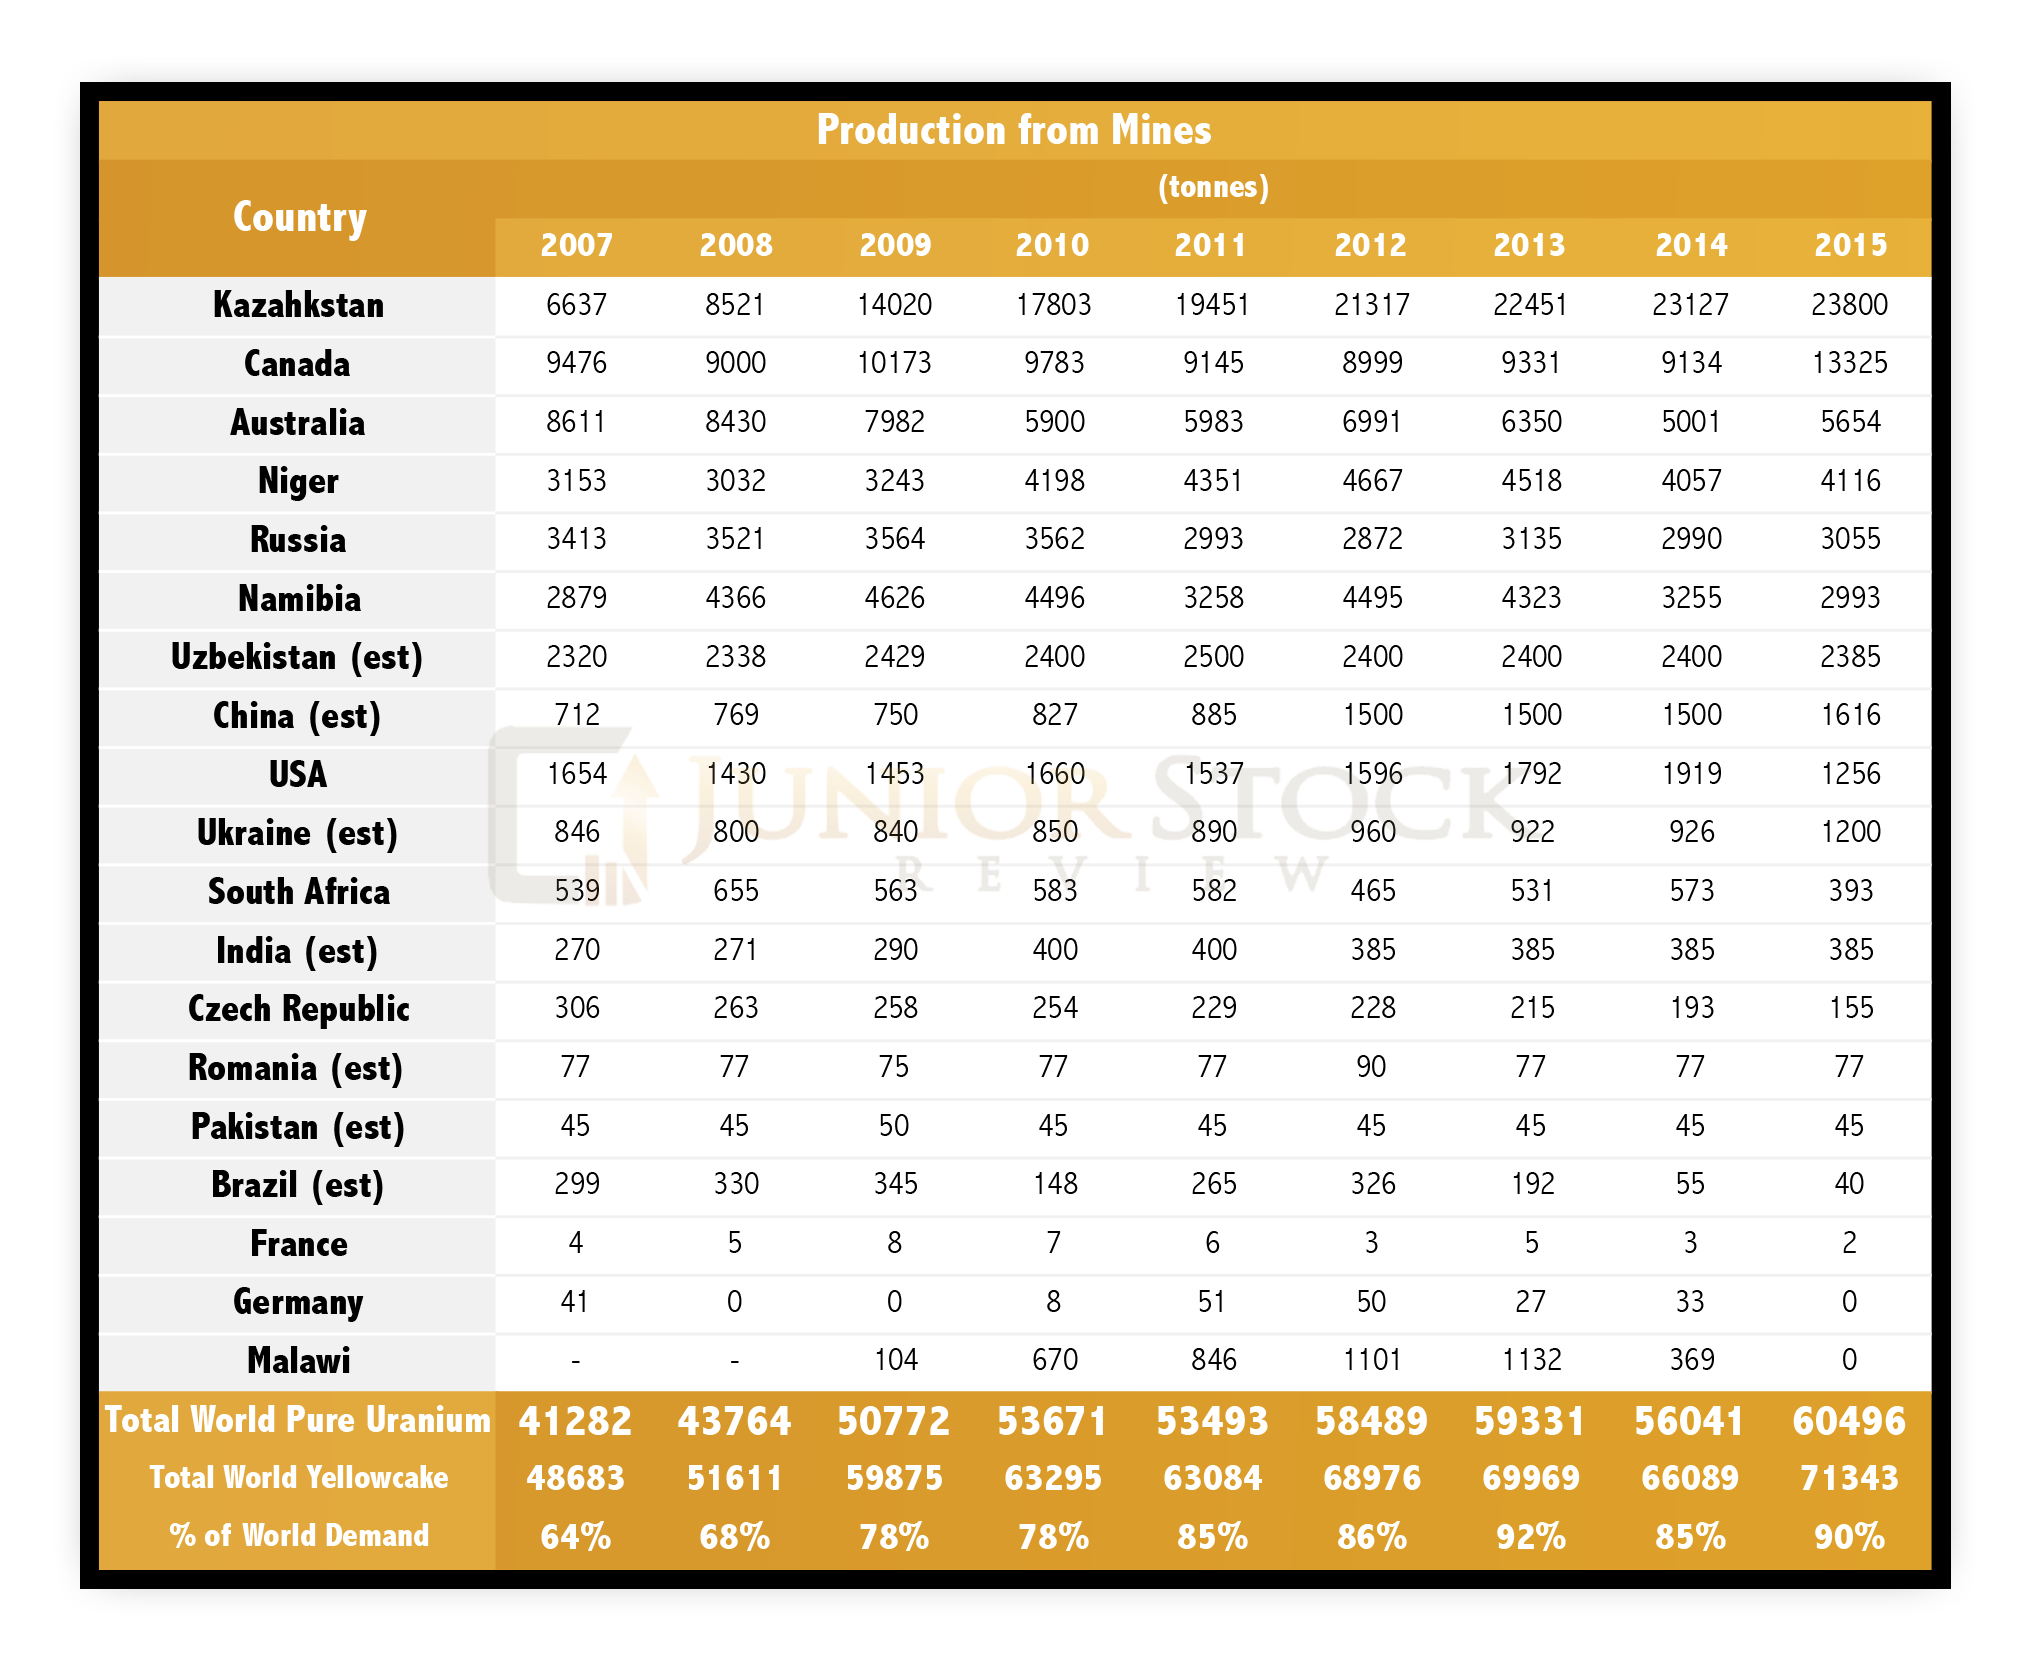
Going back to our notes in, The Uranium Supply Story, who are the countries producing the most uranium? Secondly, who are the end users? Now, this is further complicated as outlined in Introduction to the Nuclear Fuel Cycle; remember, there are multiple steps before Yellowcake can be turned into usable nuclear fuel assemblies.
Case Study – The United States
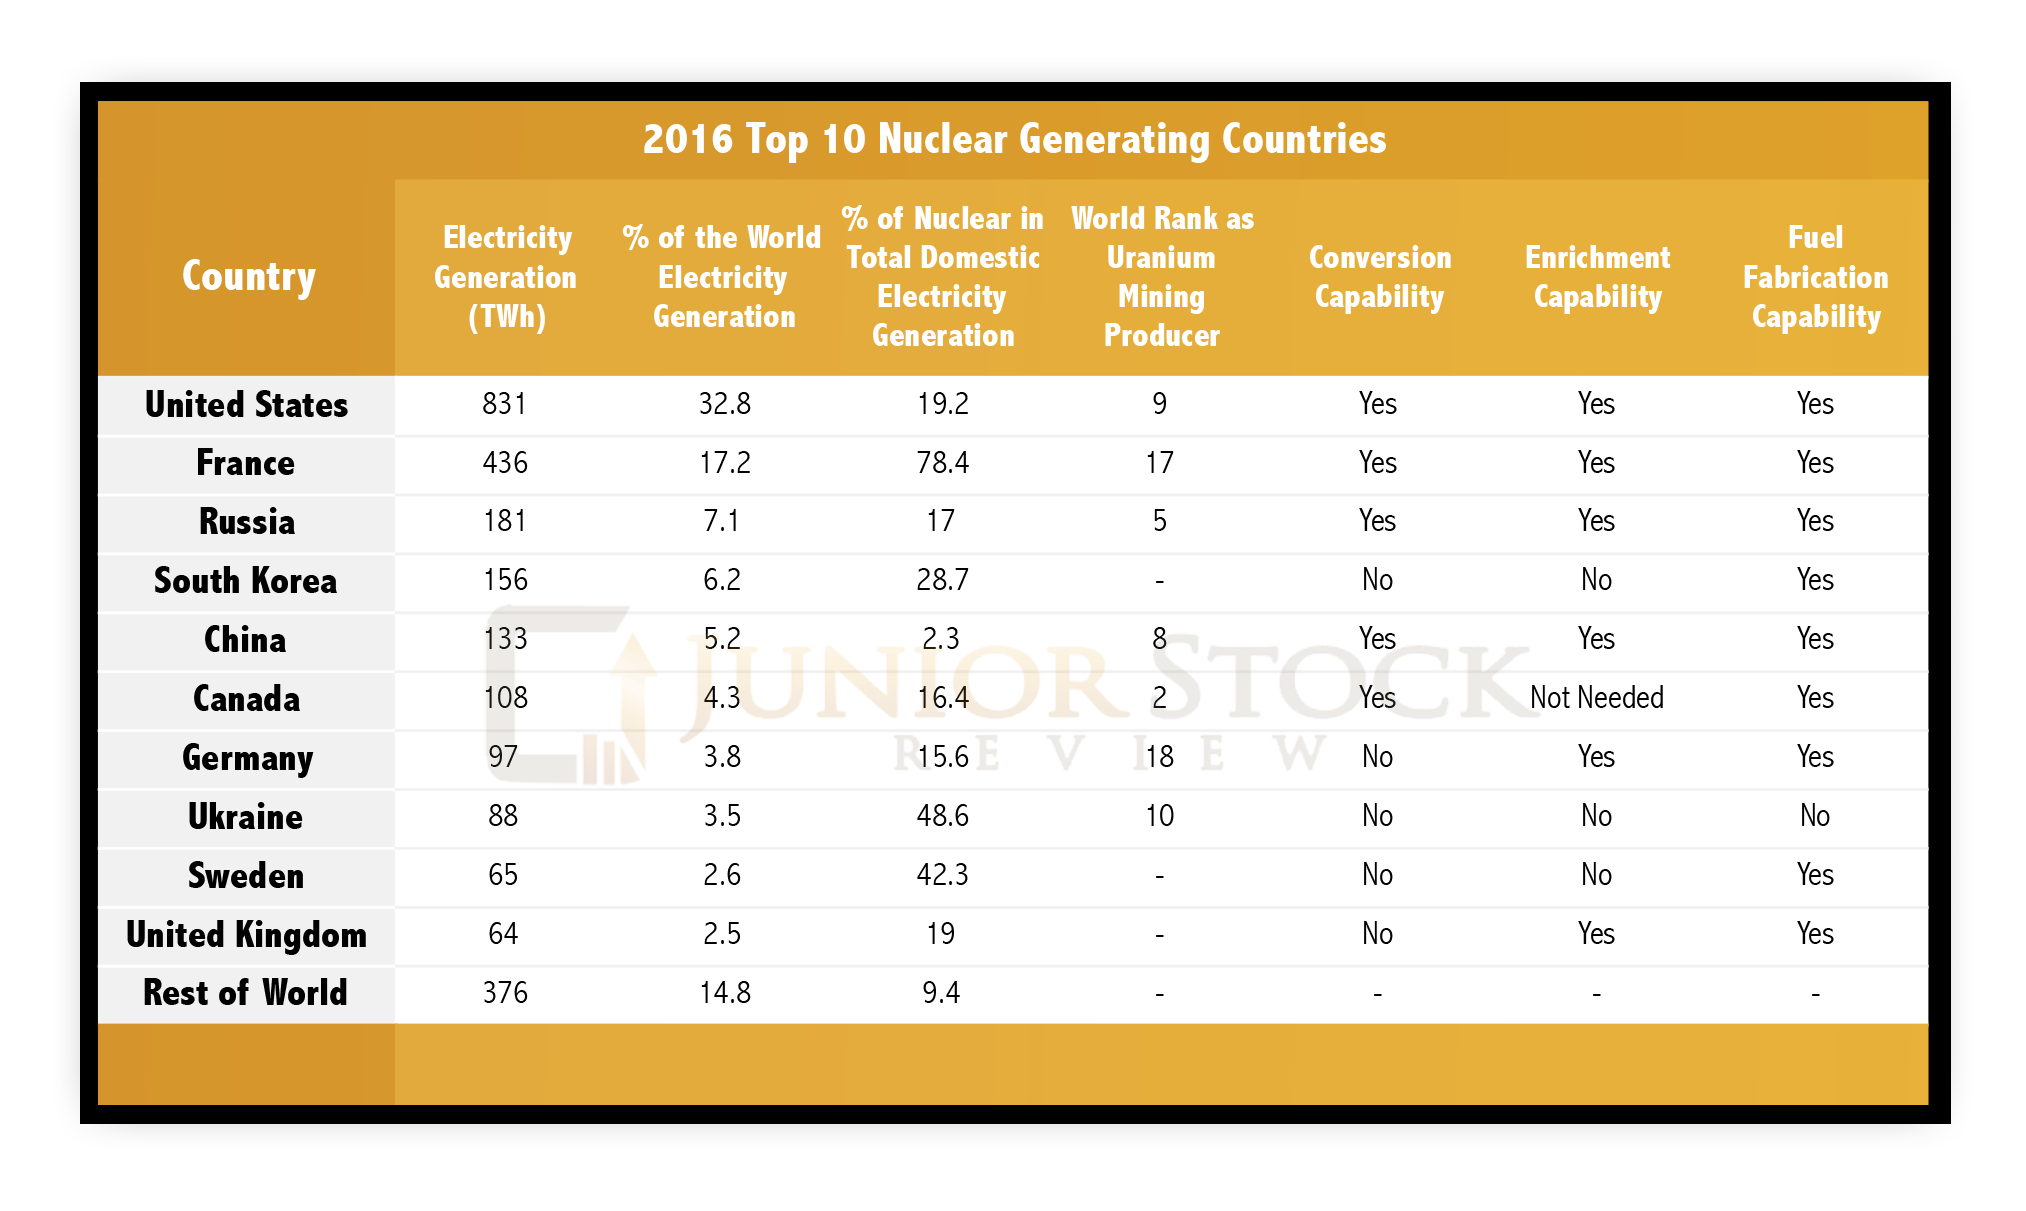
The United States is the number one generator of nuclear power in the world. Also, it is the 9th largest producer of uranium. The following case study will show that the U.S. is consuming much more uranium than it produces, which, depending on perspective, could be an issue in the future.
Nuclear Power Generation Calculation:
I used the Nuclear Fuel Material Balance Calculator found on WISE Uranium Project to calculate nuclear power generation from an input of milled tonnes of uranium.
NOTE: Please don’t take this calculation as an absolute. The inputs for the process parameters were taken and supported from a few sources: World Nuclear Association, International Atomic Energy Agency and WISE Uranium Project. If you feel my calculation is not adequate, please reproduce with your own process input parameters.
As you can see from the above case study, the U.S. mined production represents a very small percentage of their uranium power generating needs. Detailed in the following table is the USA Energy Information Agency’s breakdown of the purchased uranium in years 2011 to 2015. Specifically, refer to the data in ‘purchased from foreign suppliers’ and you will see that the U.S. purchased 68% of their uranium in 2015 from foreign entities.
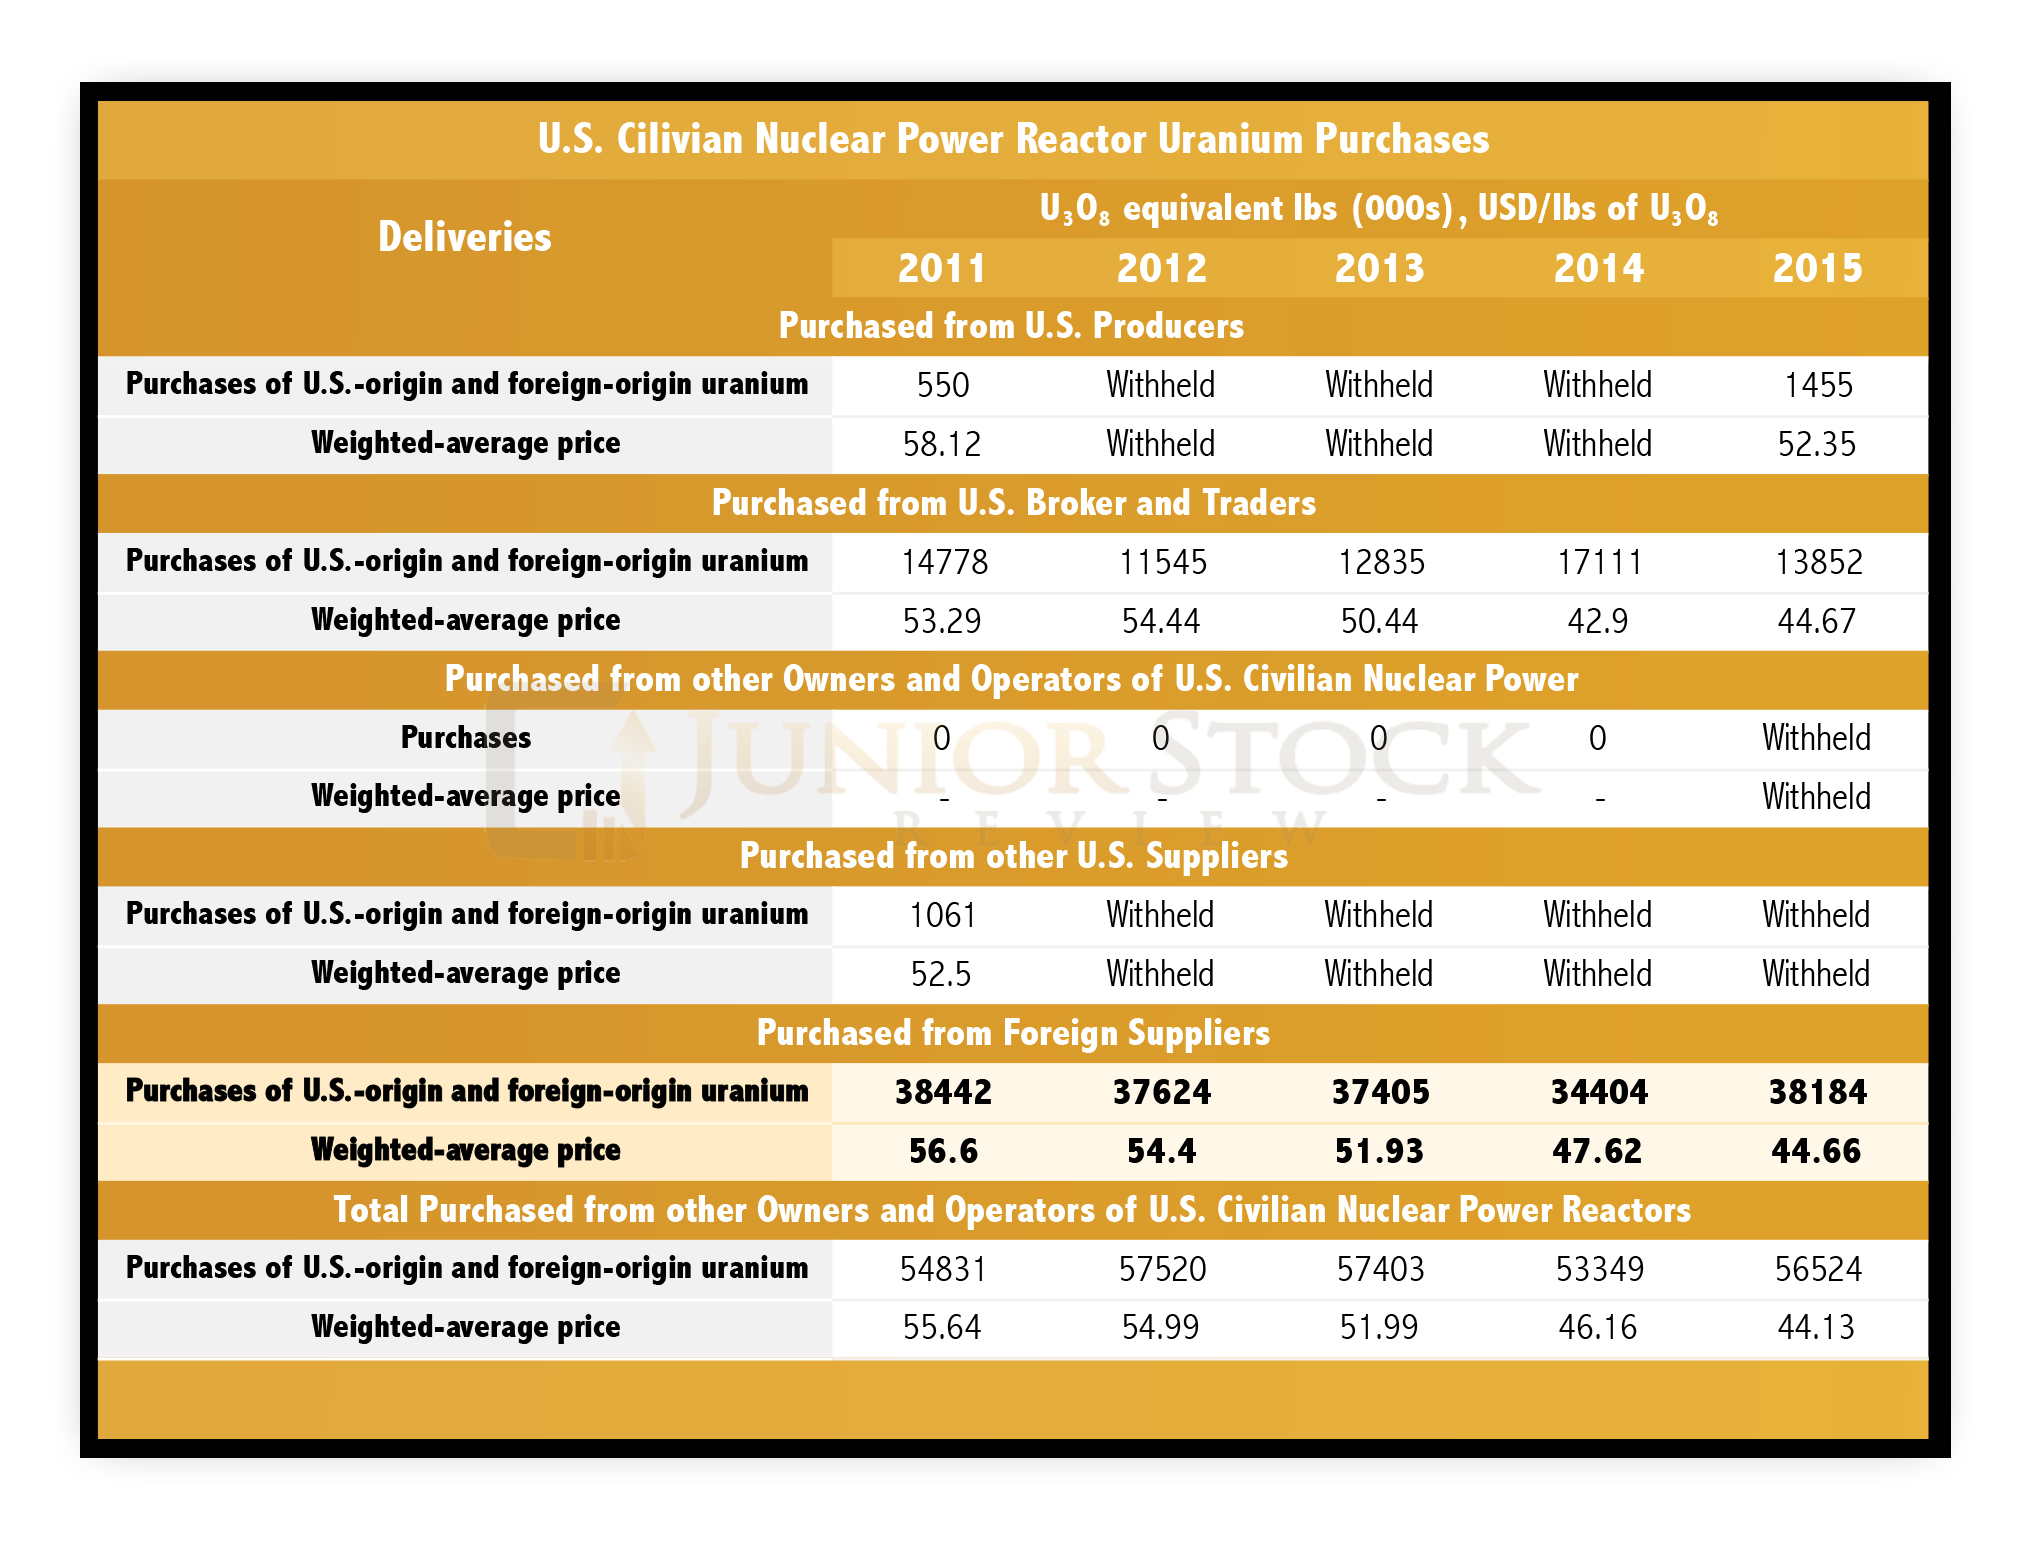
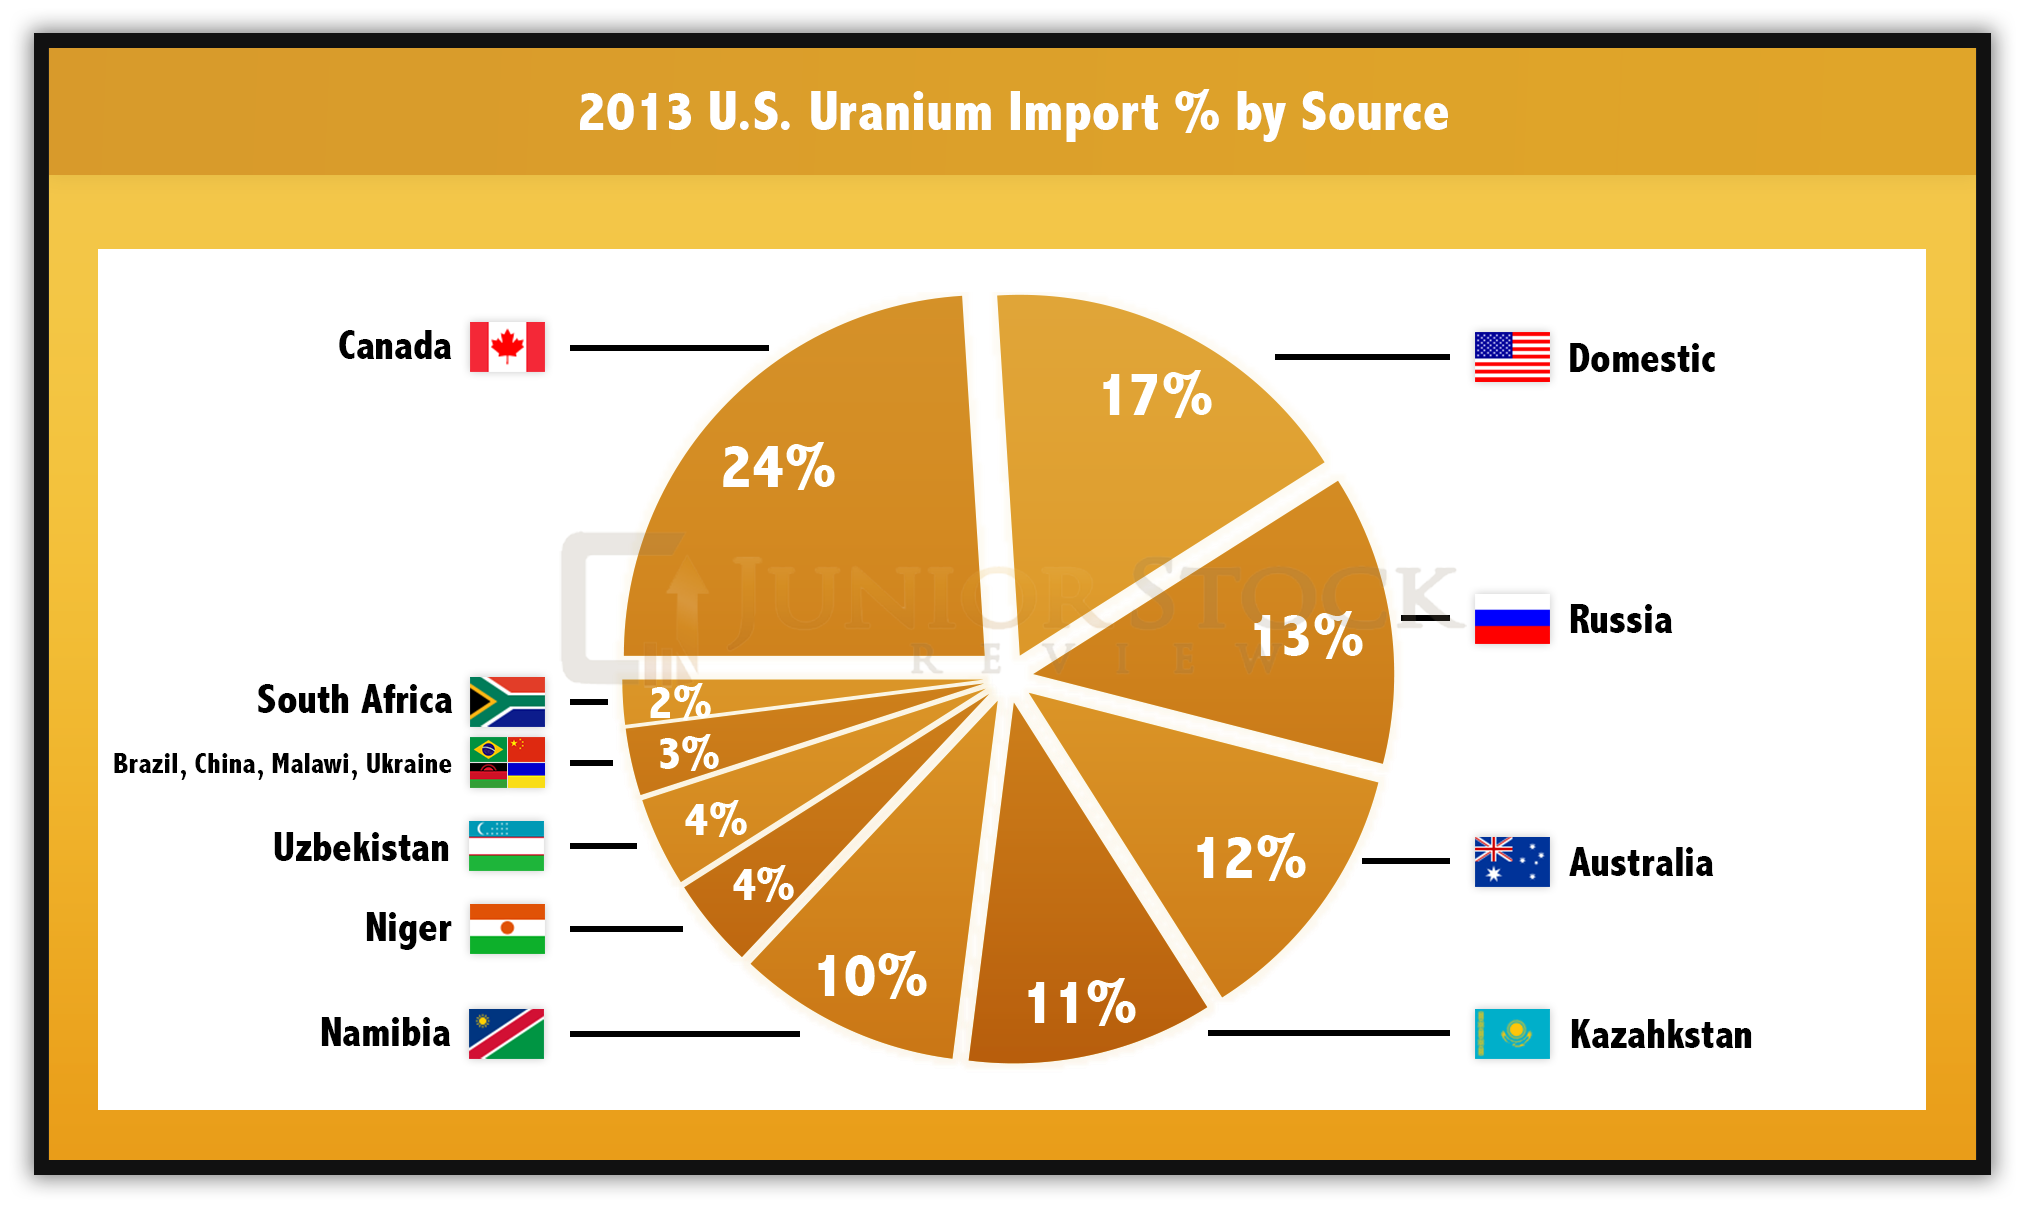
In a reverse calculation using the same input process parameters, but inputting the final power generation of 831,000 GWh, the calculator shows us that the U.S. would need to produce 19,648.45 tU or 23170.3 tU3O8, which translates into 51,081,767 lbs U3O8 to cover their nuclear power needs. This calculation is right in line with what the U.S. actually purchased in 2015. The variation between the two numbers most likely has to do with the enrichment grade of the UF6, which has a dramatic effect on the numbers. The reverse calculation is a check item for me, that the calculator is in the ball park of what was actually purchased. I’m satisfied that the calculator is accurate.
The Rest of the Nuclear Fuel Cycle
How does the USA do after they get their imported uranium? Actually, quite well. They have enough conversion and enrichment (both operational and in construction) capacity to support their current fuel assembly needs.


The interesting part about the USA case study is that it reflects the state of most of the top nuclear power generators. It appears that Canada is the only top 10 nuclear power generating nation (108,000GWh 2016) to have surplus uranium production (2015 – 13,325 tU translates into 563,559.8 GWh). Is there potential for political strife? We will tackle this later, in the scenarios.
Now let’s review who actually can convert their uranium into UF6, then enrich to 3.5 to 5 % U-235, and finally, fabricate fuel assemblies. The conversion and enrichment processes are very concerning for a major portion of our top ten generators, as they rely on someone else to convert and enrich their uranium. The fuel assembly portion of the cycle, however, seems to be more universal, as the majority of the top users have facilities.

Source:World Nuclear Association

The main reason for the lack of conversion and enrichment capability? Fear. The fear of nuclear weapons production has kept these two integral parts of the nuclear fuel cycle restricted to a lucky few. For some, the answer to this issue is the Candu reactor. As explained in Part 1 of this series, the Candu reactor does not require the enrichment of the uranium, which eliminates the enrichment cog in the cycle.
Future Construction of Nuclear Reactors
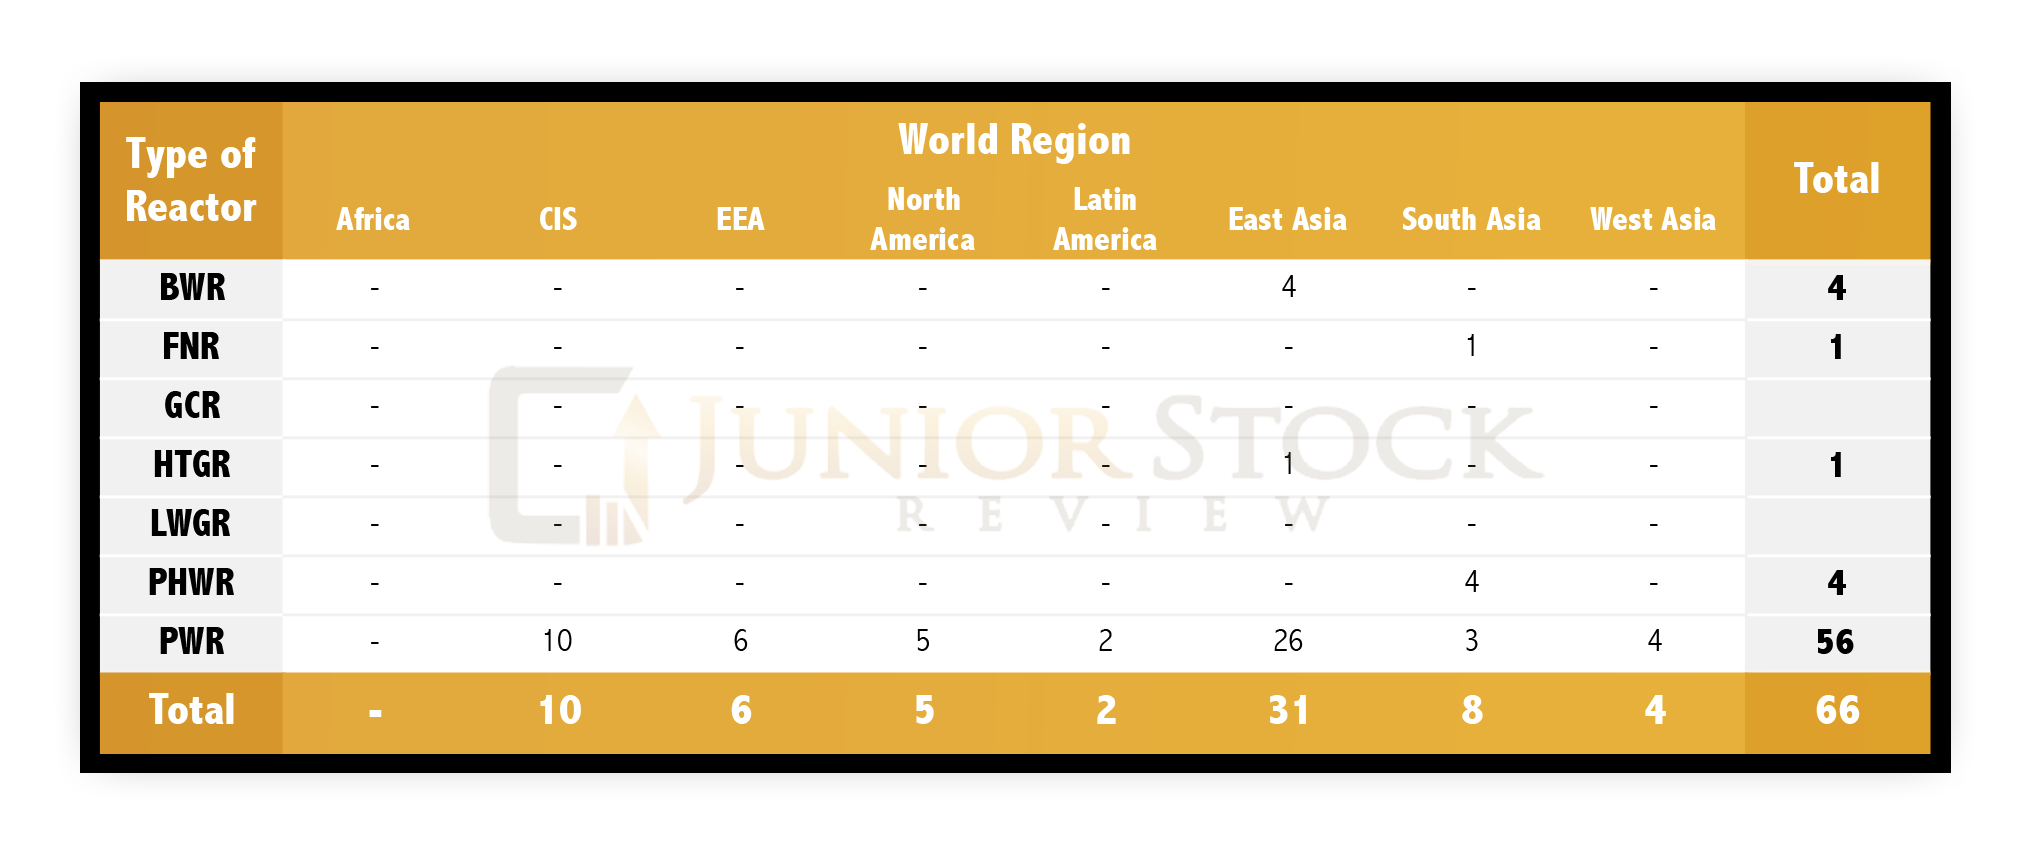
Source: World Nuclear Association- World Nuclear Performance Report 2016 – pg.14
Examining the table, you can see that Asia as a continent has 43 reactors or 65% of the total reactors under construction in the world. Referring back to the table of uranium producers, other than China, India and Pakistan, there aren’t any other producers in Asia (excluding Russia and Kazakhstan). As of 2015, the annual production of the three Asian nations was 2046 tU, which is enough uranium to produce 86,967.17 GWh (value calculated with same inputs parameters as previous). China alone produced 133 000 GWh of nuclear generated electricity. The influx of new reactors is going to swing a lot of resources in Asia’s direction.
Besides reactors under construction, the World Nuclear Association states “In all, over 160 power reactors with a total net capacity of some 182,000 MWe are planned and over 300 more are proposed.” Currently, a new reactor that was started in 2015 is estimated to take 73 months to complete. This is a huge time lag between breaking ground and connecting to the electrical grid. It’s something that pundits say is a negative for adopting nuclear power for the future. Is the time lag the problem or is it the slow decision making process? I tend to think it’s the latter.
The Emergence of the Millennials

The world’s population has been steadily growing, as can be seen in the graph illustrating world population since 1950. It’s said that the oldest trend in motion is the ascension of man, which, from a population standpoint, I definitely believe to be true.
Today, we live in the so-called information age, where the communication of ideas and facts is only a click of a mouse away. This new age has given birth to a new generation of workers and consumers, the Millennials. The Millennials represent a group of people born between 1982 and 2002 (give or take a couple of years, depending on the source of the age group), who were brought up with the most technology of any prior generation. With the oldest Millennials in their mid-30s, technology is a major source of transportation, entertainment and comfort.
From a world demographic standpoint, the Millennials are currently the dominant (by size), demographic in the world. Take a look at the table, below:

The Millennial generational dominance isn’t one that is limited to just one area of the globe; in the graph below, you will see that each area has a strong percentage of people in the Millennial generation. In fact, Europe is the only area that currently has another generation that’s larger.
I believe that even without this generation’s dominance, like Ray Kurzweil’s Singularity Theory, we are headed towards a further integration of technology into our everyday lives – not away from it. An increase in tech equals an increase in the population’s electrical needs, and this is supported further by the Millennial’s daily habits and aspirations.
If demographics interest you, and you want to dig further into this fascinating topic, you need to check out William Strauss and Neil Howe’s, The Fourth Turning.
Environment – Direct and Indirect Emissions
Arguably the strongest current trend in motion is the world environmental movement. The fight against global warming has become an international topic, with the introduction of carbon credits and the Kyoto Accord, as just two examples. Organizations around the world are banding together to reduce carbon emissions. What is undisputable, in my mind, is that the world is warming. Now, the reason why it’s warming is up for debate, and for the purpose of this report, it really doesn’t matter other than the vast majority of environmental groups attribute a warming climate to CO2 emissions.
Go back to the first graph in this report; our use of fossil fuels has never been so high. Its integration in our infrastructure, resource availability and its knack for providing consistent and constant base load power has maintained fossil fuels as our go-to energy source. I do believe that this is going to change as nations like China move toward improving the air quality in their cities. How are the Chinese going to do it? Right now, a major proportion of that future clean energy production will come from nuclear.
In my fourth year of university, I took a course on energy sources and how our society uses them. For me, one of the biggest takeaways was the reminder that carbon emissions aren’t just a by-product of the fuel being consumed, they also occur when the fuel is being grown and harvested (biofuels, such as ethanol) or being manufactured (solar panels or wind turbines). To truly understand an energy source’s carbon impact, you need to review the direct and indirect sources of emissions.
The following table was summarized from the World Energy Council’s (WEC) report on the Comparison of Energy Systems using Life Cycle Assessment.

The WEC’s report shows the direct and indirect effects of implementing the various energy sources. Also, it uses a range of highs and lows for the energy source, which I think is good as it shows that they took a number of experimental readings, not just one kick at the can. Surprising to me, and maybe you, nuclear power is right at the bottom with the lowest range of carbon equivalent emissions. Even with all of the fear and push to get away from nuclear energy, I think that this fact is what pushes nuclear power into a bigger role in world electrical energy production.
Positives and Negatives of Nuclear Power
Positive #1 – 450 Scenario Goals
As discussed earlier in this report, the direct and indirect emissions from nuclear power are small in comparison to its fossil fuel generating cousins. Emission reduction policy, such as the 450 scenario, which is based on pledges announced in association with the Copenhagen Accord and Cancun Agreement, are calling for dramatic reductions in CO2 emissions across all of the contributing sectors. The 450 scenario proposes a reduction from current totals, or the 2014 total 32,381 Mt CO2, to a maximum 18,777 Mt CO2 in 2040.

Reducing 13,604 Mt of CO2 is equivalent to removing 17.8 million GWh from the current world energy consumption. To really get an idea of how much energy 17.8 million GWh is, we can compare it to World electricity output, which was 23.8 million GWh in 2014. The 450 scenario goal is a massive reduction in emissions, one that is, in my opinion, only achievable if nuclear power is used to make up for the removal of fossil fuels.
Sample Calculation:
Input – 761 t CO2/GWh (average of tonnes of CO2/GWh across the 3 fossil fuels)
32,381 – 18,777 = 13,604 Mt
13,604 Mt = 13,604,000,000 t
13,604,000,000 t x 1/761 GWh/t = 17,876,478 GWh
Positive #2 – Nuclear Power Safety
How safe is nuclear power? Statistically speaking, very safe. In comparison to other electricity generating processes nuclear power has a good track record.

This table does not include any information from Fukushima, as the rates are taken from European data. As noted in The Uranium Supply Story, however, there were no deaths directly linked to the reactor meltdown. The deaths in this tragic event were attributed to the tsunami. In the article, Electricity Generation and Health, which is found in the publication, Energy and Health 2, authors Anil Markandya and Paul Wilkinson put nuclear power safety into perspective when they give an example of a French plant:
“The data…show occupational deaths of around 0•019 per TWh, largely at the mining, milling, and generation stages. These numbers are small in the context of normal operations. For example, a normal reactor of the kind in operation in France would produce 5•7 TWh a year. Hence, more than 10 years of operations would be needed before a single occupational death could be attributed to the plant,” ~Anil Markandya and Paul Wilkinson – Electricity Generation and Health pg. 982
To note, the Chernobyl disaster accounted for 49 deaths directly, and the UN believes that 4000 other premature deaths in the area can be attributed to the radiation poisoning.
From an historical standpoint, it’s clear that nuclear power is safe, especially when compared with the other energy generating mediums.
Positive #3 – Cost per KWh

Nuclear power is cheaper per kWh than coal and natural gas by a comfortable margin. Even in comparison to onshore wind, it’s cheaper in most countries. As a consumer of energy, this is a plus for the nuclear power case. It’s hard to argue against clean and cheap energy.
Negative #1 – Meltdown
Even though, comparatively, nuclear reactor meltdowns have caused far fewer deaths than other electricity generating fuels, the general public is fearful. The “what if” scenarios of the reactor process are generally used by pundits who are against the use of nuclear power. “What ifs” are hard to argue against because they usually have some validity – they could occur. In reality, though, history doesn’t lie; the deaths and illnesses related to nuclear accidents are very low. I understand the fear, to an extent, but I don’t think it’s rational.
Negative #2 – Construction Time
Currently, the WNA says that nuclear power plants constructed in 2015 have a 73 month construction timeline. This long period of time is another negative for pundits who are against nuclear power. They claim that because it takes so long to construct a nuclear power plant, we end up burning more fossil fuels in the meantime, which means we’re still contributing to carbon emissions.
Personally, I don’t fully understand this as a constructive criticism of nuclear power. It definitely isn’t a plus for nuclear power, but how do you discount all of the positives because it takes a long time to construct? I think it’s more of an issue in navigating the bureaucracy of government and the decision to move forward with these projects that causes delays for construction. To be clear, I’m not a fan of communism, but look how effective the Chinese have been in their pursuit of clean energy; 20+ reactors are currently under construction!
Negative #3 –Depleted Uranium Storage
Radioactive waste storage is another hot topic for those against nuclear power. A great debate that I watched from the TED talks video series on youtube.com, matches Stewart Brand and Mark Z. Jacobson against one another debating on the pros and cons of nuclear power.
Stewart Brand starts the debate off with the pros of nuclear power and presents a lot of great information, especially his comparisons of waste storage. One comparison to note:
“Nuclear waste – 1GW-year = 20 tons or 2 casks versus Coal Waste – 1 GW-year = 8,000,000 tons CO2” ~Stewart Brand@ time-3:40
When comparing waste volumes and/or CO2 emissions, the other fuels don’t come close to matching nuclear power. In the cons portion of the debate, which Mark Z. Jacobson leads, the association of nuclear waste and terrorism are combined as a concern or a point against nuclear power. It looks like a “what if,” and it’s hard to dispute, but historically, it hasn’t been an issue. Citing terrorism is an extremely effective way to bring out the “what if” argument, something that’s been used heavily by governments near and far.
Final Remarks
World uranium demand is complicated and there are many different factors that affect how much of it is needed. I believe the main factors currently affecting uranium demand are the following: politics, population & technology growth and the clean energy movement.
In the demand analysis, uranium mining/milling production and current electrical demand were examined, with some estimations of current consumption. These estimations are very hard to make, as they require many assumptions, such as enrichment % of U-235, which is not the same for every reactor.
Although there is error in assumptions, the uranium supply and demand numbers do appear to balance fairly well, with the error pointing to there being an over-supply. I don’t, however, believe that the uranium demand story is told from a straight numerical view. It’s about who controls the uranium supply in peace and at war, how air can be made cleaner by way of lower CO2 emissions, and what energy source can provide a growing world population with the base load power required to run its insatiable thirst for electrical energy.
I believe the most effective way to complete this analysis is to construct a few scenarios and apply what was covered in Parts 1 to 3A.
As always, thanks for subscribing! If you found value in this report, follow Junior Stock Review on social media (Linkedin, CEO.ca, Twitter), or recommend this FREE service to a friend or colleague.
Until next time,
Brian Leni, P.Eng


